
The average environmental footprint of residents of Estonia and Europe
The average environmental footprint of residents of Estonia was found in 2019 to be 3.8 times the limit that the Earth can tolerate, which was higher than the average of 2.9 for residents of Europe. The environmental footprint of average household member in Estonia is bigger than that of European residents from electricity, heating, food and purchases of household appliances, while the environmental footprint from transport was smaller than the European average.
To bring this down to the sustainable limit for the Earth needs the environmental impact of electricity and heat to be reduced in Estonia above all, but people can equally reduce their own environmental footprint, by changing their consumption behaviour and habits. For example replacing heating from stoves with district heating would reduce the environmental footprint by 15% in urban areas and by 10% in Estonia as a whole. Cutting the use of firewood in rural districts by 50% through improved building insulation or more effective heating systems could decrease the environmental footprint of those rural districts by 17%. Dietary changes, like reducing meat consumption to the levels recommended by the National Institute for Health Development, could lead to a 5% reduction in the environmental footprint. The environmental footprint can also be reduced through how people move around, and it could be cut by 3% if 20% of car journeys were replaced by public transport.
The results of the work by researchers and the European Commission have been used to make the Consumer Footprint Calculator for measuring how consumption fits in the sustainable limits of the Earth. A footprint with a score below one is safe from the point of view of environmental sustainability, and scores between one and two are in the grey area for sustainability meaning it is not certain whether this would lead to further environmental degradation. There is a serious risk to life and the environment once a score is twice the Earth’s tolerance limit or more. Everybody can calculate their own environmental footprint from the website https://knowsdgs.jrc.ec.europa.eu/cfc.
Individuals have the opportunity to assess their consumption in terms of its environmental impact, and can compare that with the limits the Earth can tolerate. The researchers have defined a methodology for calculating the limits of sustainable tolerance by using 16 key categories. Of those categories, 12 have an impact at the local level, while four consider bigger global issues — climate change, reduction of the ozone layer, fossil fuels, and depletion of natural resources.
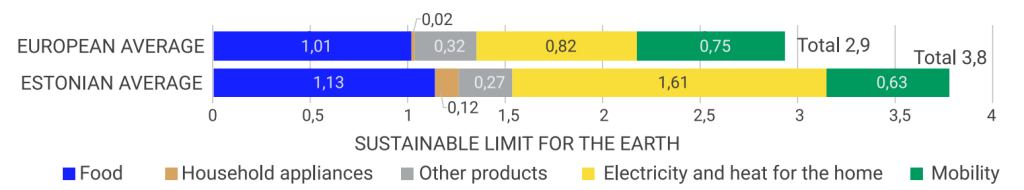
Figure 1. Average environmental footprint of residents of Europe and Estonia
Sources: European Commission, LEU, calculations by the author
Consumption by residents of the European Union exceeds the sustainability limits of the Earth 2.9 times. The biggest environmental impact comes from producing the food consumed, which is 35% of the footprint, while electricity and heat for homes is 28% and the transport used to provide mobility is 26%.
The data from the household budget survey show that the footprint of the average resident of Estonia1 in 2019 was 3.8 times the level that the Earth can sustainably tolerate. The largest part of their environmental footprint is the 43% that comes from electricity and heating for homes, followed by the 30% for producing the food they consume, and the 17% for transport and travel. The average resident of Estonia is different to the average European resident mainly because their environmental footprint from the electricity and heating for their home is larger. This discrepancy is influenced by a combination of factors. One aspect is the colder climate; Eurostat data reveals that heating consumption in Estonia is significantly higher compared to the European average. Additionally, the variation is also influenced by differences in energy sources being utilized. Heating in Estonia relies more on wood as a fuel source and the environmental footprint of each KWh produced from wood is twice that of a KWh from natural gas, which was by far the main source of energy in Europe in 2019.
The fleet of cars used in Estonia is one of the oldest in Europe, but the environmental footprint from mobility is smaller than the European average. This variance can be attributed to the fact that people in Estonia fly less, so that while air transport provides 27% of the environmental footprint from mobility in Europe, it provides only 2% in Estonia.
People can make some difference to their environmental footprint by changing their consumption, but introducing green technology would have a bigger effect. The European Union’s REPowerEU funding programme for developing and applying green solutions has been launched to this end.
In terms of categories, the greatest issues both in Europe and in Estonia are related to particulate air pollution (exceeding the Earth’s tolerance limit by 8.5 times in Europe and 15.9 times in Estonia), freshwater toxicity (exceeding the limit by 7.7 times in Europe and 12.6 times in Estonia), acceleration of climate change through carbon emissions (exceeding the limit by 7.6 times in both Europe and Estonia), and depletion of fossil fuel resources (exceeding the limit by 2.9 times in Europe and 2.6 times in Estonia).
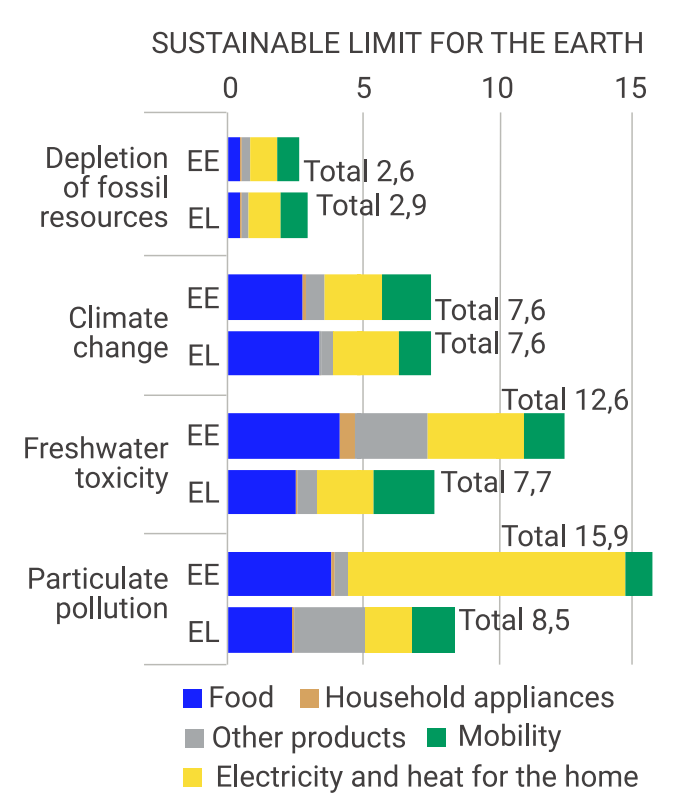
Sources: European Commission, LEU, calculations by the author
Air pollution from particles is a local issue and is seen in deaths caused by particulate matter. The large amount of solid particles in the air in Estonia is mainly a consequence of burning wood for heating. Work published in 2011 found that fine particles in the air caused an average of 600 premature deaths in Estonia each year2.
The toxicity of freshwater is also driven by local and regional factors. Producing food for consumption contributes 33% of this, electricity and heat contribute 29%, and 22% comes from other products consumed by the household. The four main categories under food are pork, the production of which provides 18% of the indicator for freshwater toxicity; chocolate, which provides 15%; seasonal fruit at 7%; and cheese, also at 7%.
The footprint of the average person in Estonia at accelerating climate change is the same size as the average in Europe at 7.6. The green transition is often seen as a fight against climate change, but actually climate change is only one part of the total human impact on the environment. The impact on the climate is measured using CO2 equivalent, which is a measure of global impact. To bring the earth to within its limits of sustainability would need the emissions from consumption caused by each resident to be below 1000 CO2 equivalent. Producing food for consumption is the biggest source of emissions at 36% of the total, while electricity and heat for homes provides 29% and transport used to provide mobility causes 24%.
The footprint of the average person in Estonia in depleting fossil fuel resources is smaller at 2.6 than the European average of 2.9. The biggest factors in both cases are electricity and heat for the home and mobility. Fossil fuels are mainly oil, natural gas and coal.
The average European is within the sustainable limits of the Earth for all the other indicators. Depletion of natural resources comes close to the limit at 0.9, as do eutrophication of seawater at 0.7 and acidification at 0.7.
The average person in Estonia is also within the safe limits for the other indicators except depletion of natural resources, which is at 1.6. Natural resources primarily mean minerals and metals like indium, gold, tantalum and silver. Consumption of household appliances accounts for 48%, or nearly half, of the depletion of natural resources, and comes mainly from televisions and computers. Depletion of natural resources is a factor with global impact, and future generations will be less able to use those resources. It is very important in this for goods to have the longest possible lifespan, and for the materials used in equipment that is no longer in use to be recycled.
Eutrophication of seawater, freshwater and groundwater by the average resident of Estonia does not exceed the sustainable limit for the Earth, but the Baltic Sea is among the seas of the world that is most threatened by it3. Eutrophication is the excessive concentration of nutrients for plants that reduces the oxygen levels of the water and arises when excessive amounts of nutrients for plants, mostly nitrogen and phosphorous, enter the water, mainly because of human activity.
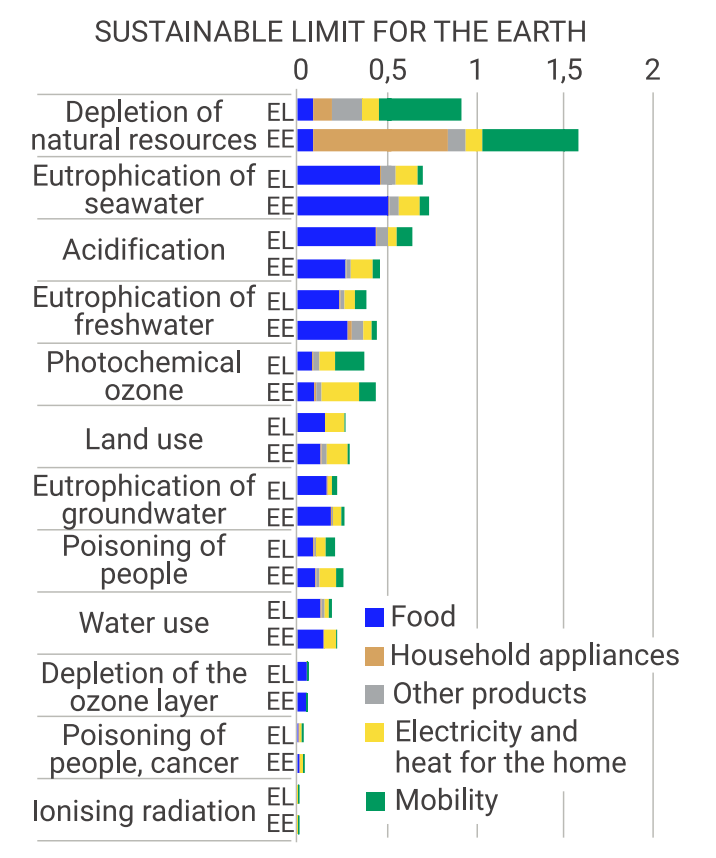
Sources: European Commission, LEU, calculations by the author
References:
1. The average resident of Estonia is found from the data in the household budget survey, and the consumption of each household member is adjusted using modified weights from the OECD, where the first adult person has the weight of 1, other people above the age of 14 have the weight of 0.5, and those under 14 are weighted 0.3.
2. Orru, H. et al. (2011). Välisõhu kvaliteedi mõju inimeste tervisele – peentest osakestest tuleneva mõju hindamine kogu Eesti lõikes (The impact of outdoor air quality on human health – assessment of the impact of fine particles throughout Estonia).
3. European Court of Auditors (2016). Combating eutrophication in the Baltic Sea: further and more effective action needed.
This short report is part of the Foresight Centre’s research stream Green transition scenarios in Estonia.
People linked to the report
Research leader
 Uku Varblane
Head of Research at Foresight Centre
Uku Varblane
Head of Research at Foresight Centre